Pandas Data Frame
- Data frame - main object in pandas, used to represent tabular data (rows and columns)
- Shortcut: B - insert new cell below / A - insert cell above
- Run cell - Ctrl + Enter
Library: https://pandas.pydata.org/pandas-docs/stable/
Notes: Lesson 1, Lesson 2, Lesson 3, Lesson 4, Lesson 5
pip install pandas (or install Anaconda)
jupyter notebook
1. Creating a data frame
Import csv file
import pandas as pd
df = pd.read_csv('C:\\Users\\Z\\Desktop\\nyc_weather.csv')
df
Import excel file
df=pd.read_excel("weather_data.xlsx","Sheet1")
df
Create dataset by dictionary
import pandas as pd
weather_data = {
'day': ['1/1/2017','1/2/2017','1/3/2017','1/4/2017','1/5/2017','1/6/2017'],
'temperature': [32,35,28,24,32,31],
'windspeed': [6,7,2,7,4,2],
'event': ['Rain', 'Sunny', 'Snow','Snow','Rain', 'Sunny']
}
df = pd.DataFrame(weather_data)
df = pd.read_csv("weather_data.csv")
df
Import as tuple
weather_data = [
('1/1/2017',32,6,'Rain'),
('1/2/2017',35,7,'Sunny'),
('1/3/2017',28,2,'Snow')
]
df = pd.DataFrame(data=weather_data, columns=['day','temperature','windspeed','event'])
df
2. Printing data
Print statistics (count, mean, std, min, 25%, 50%, 75%, max)
df.describe
Maximum temperature
df['Temperature'].max()
Give me all the data in the dataframe where Temperature > 32
df[df['temperature']>32]
1st condition: the dates on which it rains
2nd condition: give me all the dates when the events was rain
df['EST'][df['Events']=='Rain']
Give me the row where temperature is maximum, but print only day
df['day'][df['temperature'] == df['temperature'].max()]
Use day as first column
df.set_index('day')
Give me row on 1/2/2017, modify dataframe
df.set_index('day' , inplace=True)
df.loc['1/2/2017']
Reset index
df.reset_index(inplace=True)
df
Reset index, set first column as event
df.reset_index('event', inplace=True)
df.head()
Display only day and temperature
Average windspeed
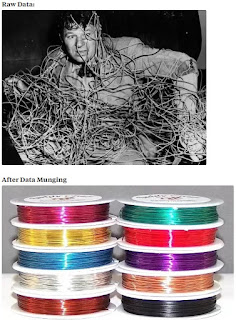
- 1st line: Data munging / data wrangling. Clean messy data (missing data points and blank entries). Fill missing NaN data with 0
df.fillna(0, inplace=True)
df['WindSpeedMPH'].mean()
Range of Index
df.index
No of rows and columns (6,4) / columns (4)
df.shape # rows, columns = df.shape
No of columns Index(['day', 'temperature', 'windspeed', 'event'], dtype='object')
df.columns
df.event
Print first five rows, can specify how many. df.head(2) means 2 rows
df.head()
Print last 5 rows
df.tail()
Indexing and slicing, print rows 2 to 4 (exclude 5)
df[2:5]
3. Header Row
Remove header row, move 2nd row upwards
df = pd.read_csv("stock_data.csv", skiprows=1)
df
the same as
df = pd.read_csv("stock_data.csv", header=1)
df
Add header row
df = pd.read_csv("stock_data.csv", header=None, names = ["ticker","eps","revenue","people"])
df
Print number of rows = 2
df = pd.read_csv("stock_data.csv", nrows=2)
df
4. Cleaning Messy Data
Not available or n.a., replace with NaN
df = pd.read_csv("stock_data.csv", na_values=["n.a.", "not available"])
df
Convert revenue -1 to NaN, but keep EPS -1
df = pd.read_csv("stock_data.csv", na_values={
'eps': ['not available'],
'revenue': [-1],
'people': ['not available','n.a.']
})
df
Converter messy data to clean data
def convert_people_cell(cell):
if cell=="n.a.":
return 'Sam Walton'
return cell
def convert_price_cell(cell):
if cell=="n.a.":
return 50
return cell
df = pd.read_excel("stock_data.xlsx","Sheet1", converters= {
'people': convert_people_cell,
'price': convert_price_cell
})
df
Parse dates convert column to daytime '30MAR1990'
import pandas as pd
df = pd.read_csv("weather_data.csv", parse_dates=["day"])
df.set_index('day',inplace=True)
df
Replace NaN with 0 value, or specific column
new_df = df.fillna(0)
new_df
new_df = df.fillna({
'temperature': 0,
'windspeed': 0,
'event': 'No Event'
})
new_df
For a better guess, forward fill. bfill = backward fill
new_df = df.fillna(method="ffill")
new_df
Limit forward fill only one time
- Can copy data vertically or horizontally. df.fillna(method="bfill", axis="columns") # axis is either "index" or "columns"
new_df = df.fillna(method="ffill",limit=1)
new_df
Linear interpolation guess, better guess withmiddle value
new_df = df.interpolate()
new_df
Consider also time and adjust accordingly
new_df = df.interpolate(method="time")
new_df
Drop all with missing data
new_df = df.dropna()
new_df
Drop all na value
new_df = df.dropna(how='all')
new_df
At least 1 valid value to keep row
new_df = df.dropna(thresh=1)
new_df
Generate rows with missing values
dt = pd.date_range("01-01-2017","01-11-2017")
idx = pd.DatetimeIndex(dt)
df.reindex(idx)
5. Export Files
Export new csv file
df.to_csv("new.csv", index=False)
Export only specific columns
df.to_csv("new.csv", columns=["tickers","price"], index=False)
Export to excel files
- Startrow and startcol moves cells across the excel file
df.to_excel("new.xlsx", sheet_name="stocks", index=False, startrow=2, startcol=1)
Write two dataframes to two separate sheets in excel
df_stocks = pd.DataFrame({
'tickers': ['GOOGL', 'WMT', 'MSFT'],
'price': [845, 65, 64 ],
'pe': [30.37, 14.26, 30.97],
'eps': [27.82, 4.61, 2.12]
})
df_weather = pd.DataFrame({
'day': ['1/1/2017','1/2/2017','1/3/2017'],
'temperature': [32,35,28],
'event': ['Rain', 'Sunny', 'Snow']
})
with pd.ExcelWriter('stocks_weather.xlsx') as writer:
df_stocks.to_excel(writer, sheet_name="stocks")
df_weather.to_excel(writer, sheet_name="weather")


