Creating candlestick chart with TA-Lib
Install python extension package (check version)
- TA-lib-0.4.17-cp37-cp37m-win32.whl
- cp37 = python 3.7, win32 = x32, amd64 = x64
- mpl_finance
- Tutorial: https://ithelp.ithome.com.tw/articles/10206894
Go to Anaconda installed location
pip install TA_Lib-0.4.17-cp36-cp36m-win_amd64.whl
Go to mpl_finance-master folder
python setup.py install
import numpy as np
import pandas as pd
import pandas_datareader as pdr
import matplotlib.pyplot as plt
%matplotlib inline
import mpl_finance as mpf
import datetime as datetime
import talib
Use pandas_datareader to get stock data
- Store data in dataframe "df_700"
start = datetime.datetime(2018,11,1)
df_0700 = pdr.DataReader('0700.HK', 'yahoo', start=start)
Use set_xticklabels to create candlesticks
- lambda: anonymous function inside another function, disposable
- lambda arguments : expression. Can only have 1 expression
- strftime converts datetime to string. '%Y' year
- fig.add_subplot(1, 1, 1) = 1x1 grid, (2,3,4) = 2x3 grid
- ax.set_xticks(range(0, len(data['date']), 10))
ax.set_xticklabels(data['date'][::10]) display x-axis every 10 days, can switch to 30 - Load variable from matplotlib.finance.candlestick2_ochl(ax, opens, closes, highs, lows, width=4, colorup='k', colordown='r', alpha=0.75)
df_0700.index = df_0700.index.format(formatter=lambda x: x.strftime('%Y-%m-%d'))
fig = plt.figure(figsize=(24, 8))
ax = fig.add_subplot(1, 1, 1)
ax.set_xticks(range(0, len(df_0700.index), 10))
ax.set_xticklabels(df_0700.index[::10])
mpf.candlestick2_ochl(ax, df_0700['Open'], df_0700['Close'], df_0700['High'], df_0700['Low'], width=0.6, colorup='r', colordown='g', alpha=0.75);

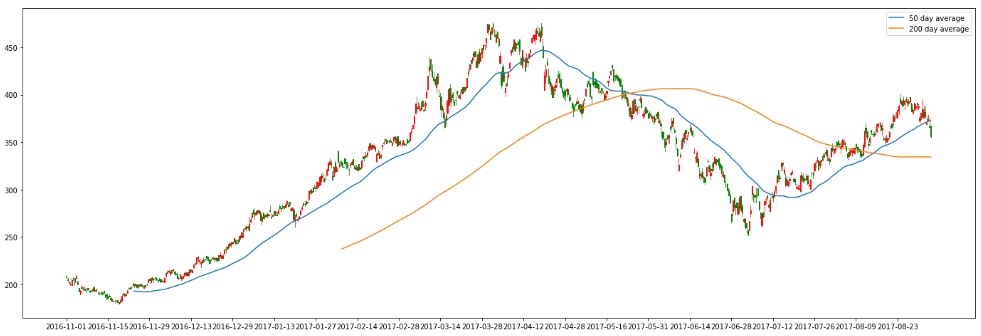
Add 50 day and 200 day simple moving average (SMA)
- Stock price below 50 day moving average is bullish, above is bearish
- Price meet 50 day support and bounces upward, think long. Bounce downwards, think short
- Price breaks 50 day SMA upward, opinion bullish. Downwards, opinion bearish
- Adjusted startdate to (2017,11,1) to show 200 day SMA
- Golden cross: 50 day SMA cross through 200 DMA to upside. Strategy is to hold until break in other side to stop loss
sma_50 = talib.SMA(np.array(df_0700['Close']), 50)
sma_200 = talib.SMA(np.array(df_0700['Close']), 200)fig = plt.figure(figsize=(24, 8))
ax = fig.add_subplot(1, 1, 1)
ax.set_xticks(range(0, len(df_0700.index), 30))
ax.set_xticklabels(df_0700.index[::10])
mpf.candlestick2_ochl(ax, df_0700['Open'], df_0700['Close'], df_0700['High'],
df_0700['Low'], width=0.6, colorup='r', colordown='g', alpha=0.75)
ax.plot(sma_50, label='50 day average')
ax.plot(sma_200, label='200 day average')
ax.legend();

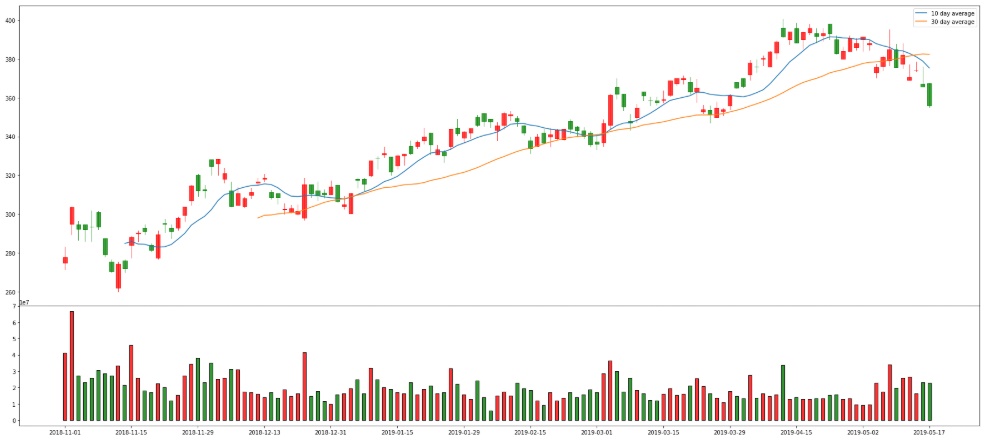
Adding Volume
sma_10 = talib.SMA(np.array(df_0700['Close']), 10)
sma_30 = talib.SMA(np.array(df_0700['Close']), 30)fig = plt.figure(figsize=(24, 15))
ax = fig.add_axes([0,0.2,1,0.5])
ax2 = fig.add_axes([0,0,1,0.2])ax.set_xticks(range(0, len(df_0700.index), 10))
ax.set_xticklabels(df_0700.index[::10])
mpf.candlestick2_ochl(ax, df_0700['Open'], df_0700['Close'], df_0700['High'],
df_0700['Low'], width=0.6, colorup='r', colordown='g', alpha=0.75)ax.plot(sma_10, label='10 day average')
ax.plot(sma_30, label='30 day average')mpf.volume_overlay(ax2, df_0700['Open'], df_0700['Close'], df_0700['Volume'], colorup='r', colordown='g', width=0.5, alpha=0.8)
ax2.set_xticks(range(0, len(df_0700.index), 10))
ax2.set_xticklabels(df_0700.index[::10])ax.legend();

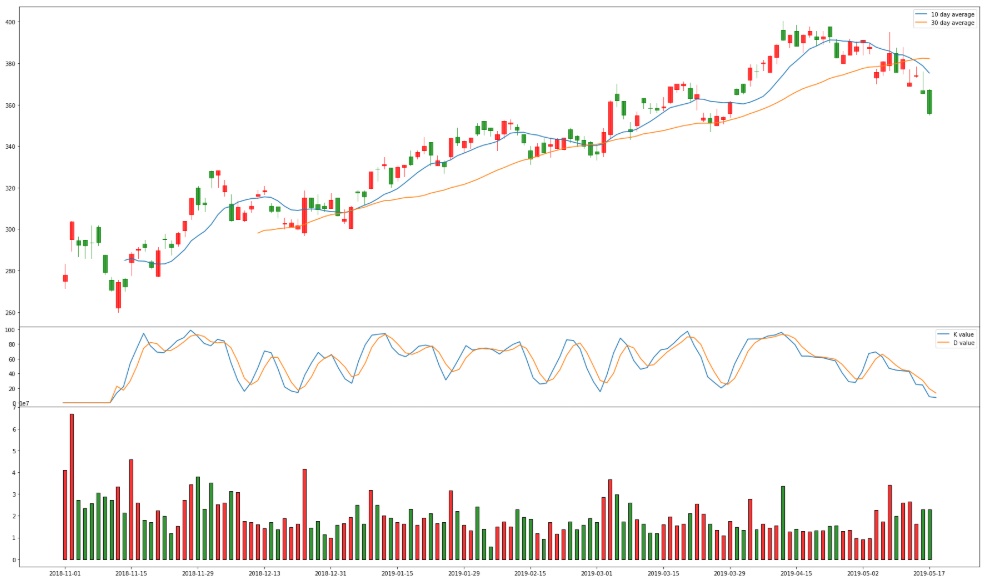
Adding KD (Stochastics oscillator)
- D>80: overbought, D<20: oversold
- When K>D: upward trend. K exceed D line: think long. K<D, think short
- Not reliable indicator in Signal more reliable when cross occur at >70 or < 30
- More accurate in large-cap shares

sma_10 = talib.SMA(np.array(df_0700['Close']), 10)
sma_30 = talib.SMA(np.array(df_0700['Close']), 30)
df_0700['k'], df_0700['d'] = talib.STOCH(df_0700['High'], df_0700['Low'], df_0700['Close'])
df_0700['k'].fillna(value=0, inplace=True)
df_0700['d'].fillna(value=0, inplace=True)fig = plt.figure(figsize=(24, 20))
ax = fig.add_axes([0,0.3,1,0.4])
ax2 = fig.add_axes([0,0.2,1,0.1])
ax3 = fig.add_axes([0,0,1,0.2])ax.set_xticks(range(0, len(df_0700.index), 10))
ax.set_xticklabels(df_0700.index[::10])
mpf.candlestick2_ochl(ax, df_0700['Open'], df_0700['Close'], df_0700['High'],
df_0700['Low'], width=0.6, colorup='r', colordown='g', alpha=0.75)
plt.rcParams['font.sans-serif']=['Microsoft JhengHei']
ax.plot(sma_10, label='10 day average')
ax.plot(sma_30, label='30 day average')ax2.plot(df_0700['k'], label='K value')
ax2.plot(df_0700['d'], label='D value')
ax2.set_xticks(range(0, len(df_0700.index), 10))
ax2.set_xticklabels(df_0700.index[::10])mpf.volume_overlay(ax3, df_0700['Open'], df_0700['Close'], df_0700['Volume'], colorup='r', colordown='g', width=0.5, alpha=0.8)
ax3.set_xticks(range(0, len(df_0700.index), 10))
ax3.set_xticklabels(df_0700.index[::10])ax.legend();
ax2.legend();